Plot a mtree tree.
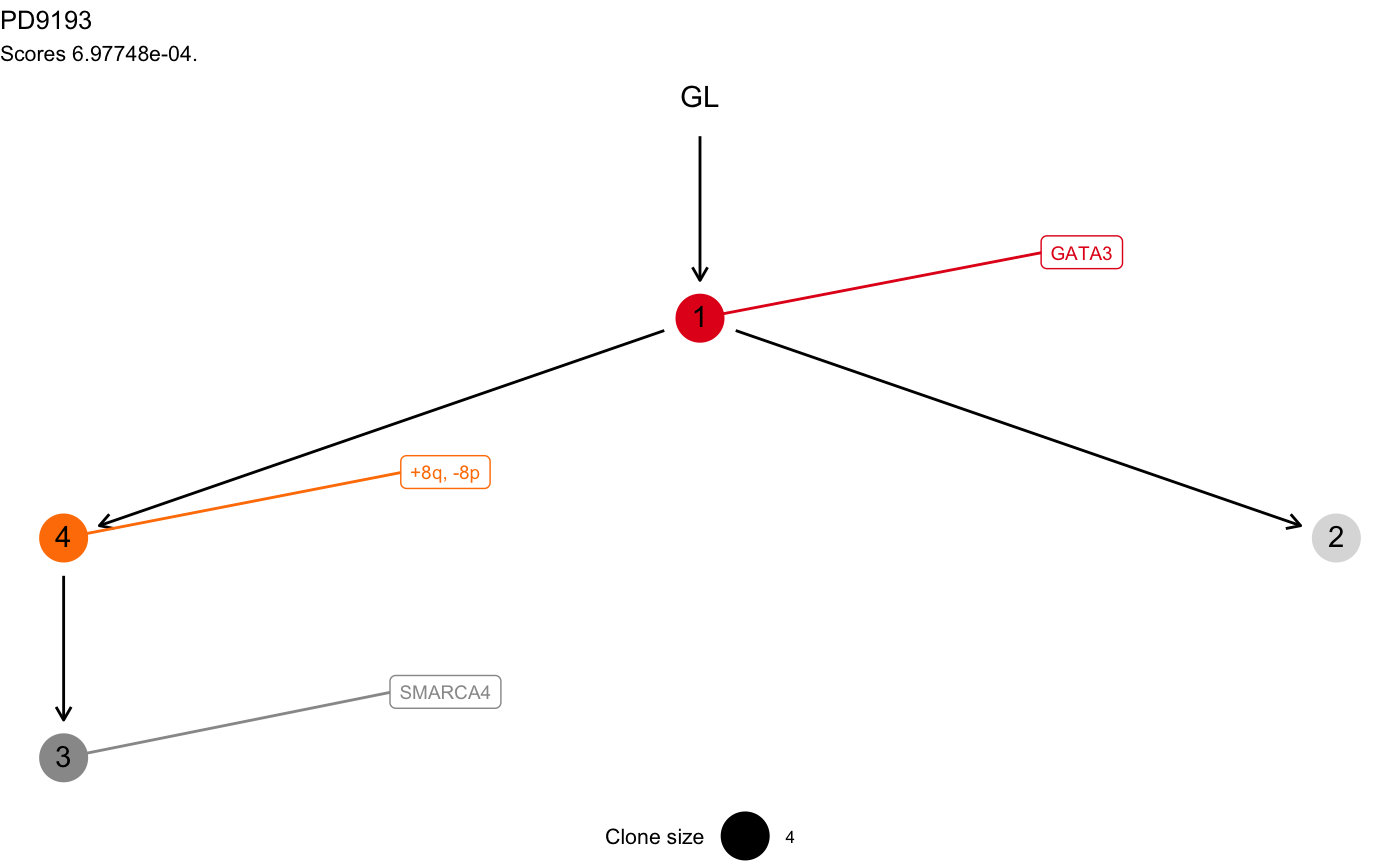
plot.mtree.RdThis S3 method plots a mtree tree, using ggraph layout
functions. The tree is annotated and coloured in each node (i.e.,
cluster) that contain a driver event annotated. The driver id is also
reported via ggrepel annotation functions.
plot.mtree(x, node_palette = colorRampPalette(RColorBrewer::brewer.pal(n
  = 9, "Set1")), tree_layout = "tree", ...)
Arguments
| x | A |
|---|---|
| node_palette | A function that applied to a number will return a set of colors.
By default this is a |
| tree_layout | A layout that can be used by |
| ... | Extra S3 parameters |
Value
A ggplot plot of the tree.
Examples
data(mtree_input) x = mtrees( mtree_input$binary_clusters, mtree_input$drivers, mtree_input$samples, mtree_input$patient, mtree_input$sspace.cutoff, mtree_input$n.sampling, mtree_input$store.max )#> [ mtree ~ generate mutation trees for PD9193 ] #> Sampler : 10000 (cutoff), 5000 (sampling), 100 (max store) #> Suppes' conditions : >= #> # A tibble: 4 x 14 #> Misc patientID cluster is.driver is.clonal PD9193d PD9193e PD9193f PD9193g #> <chr> <chr> <chr> <lgl> <lgl> <dbl> <dbl> <dbl> <dbl> #> 1 cuto… PD9193 2 FALSE FALSE 1 1 1 0 #> 2 cuto… PD9193 3 TRUE FALSE 1 0 0 0 #> 3 cuto… PD9193 1 TRUE TRUE 1 1 1 1 #> 4 cuto… PD9193 4 TRUE FALSE 1 0 1 1 #> # … with 5 more variables: PD9193h <dbl>, PD9193i <dbl>, PD9193j <dbl>, #> # PD9193k <dbl>, nMuts <dbl> #> #> ✔ Structures 3 - search is exahustive #> ✔ Trees with non-zero sscore 3 storing 3 #>#> Warning: Duplicated aesthetics after name standardisation: na.rm#> Warning: Removed 1 rows containing missing values (geom_point).