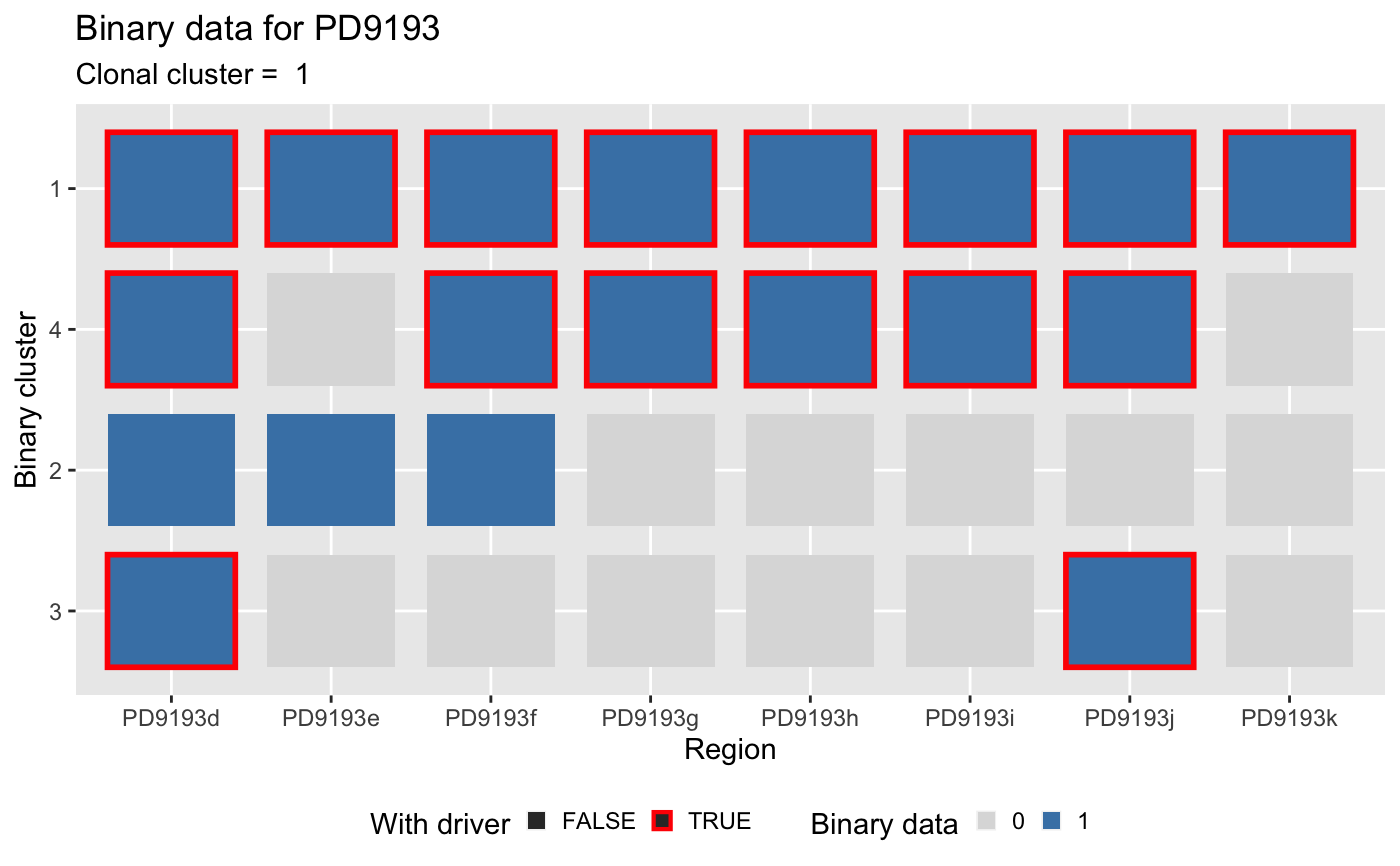
Plot binary clusters data (tile).
plot_binary_clusters.RdThis function creates a ggplot-style
heatmap of the input CCF cluster of each clone in the data.
The heatmap is annotated for the drivers status of each
clone (with/ without driver). The CCF values are used to
colour the heatmap (`NA` values are in light gray).
plot_binary_clusters(x, ...)
Arguments
| x | An |
|---|---|
| ... | Extra parameters, not used. |
| patient | A patient id. |
Value
A ggplot plot.
Examples
data(mtree_input) x = mtrees( mtree_input$binary_clusters, mtree_input$drivers, mtree_input$samples, mtree_input$patient, mtree_input$sspace.cutoff, mtree_input$n.sampling, mtree_input$store.max )#> [ mtree ~ generate mutation trees for PD9193 ] #> Sampler : 10000 (cutoff), 5000 (sampling), 100 (max store) #> Suppes' conditions : >= #> # A tibble: 4 x 14 #> Misc patientID cluster is.driver is.clonal PD9193d PD9193e PD9193f PD9193g #> <chr> <chr> <chr> <lgl> <lgl> <dbl> <dbl> <dbl> <dbl> #> 1 cuto… PD9193 2 FALSE FALSE 1 1 1 0 #> 2 cuto… PD9193 3 TRUE FALSE 1 0 0 0 #> 3 cuto… PD9193 1 TRUE TRUE 1 1 1 1 #> 4 cuto… PD9193 4 TRUE FALSE 1 0 1 1 #> # … with 5 more variables: PD9193h <dbl>, PD9193i <dbl>, PD9193j <dbl>, #> # PD9193k <dbl>, nMuts <dbl> #> #> ✔ Structures 3 - search is exahustive #> ✔ Trees with non-zero sscore 3 storing 3 #>plot_binary_clusters(x[[1]])